

This post is also available in: ![]() English
English ![]() Français (French)
Français (French)
Introduction
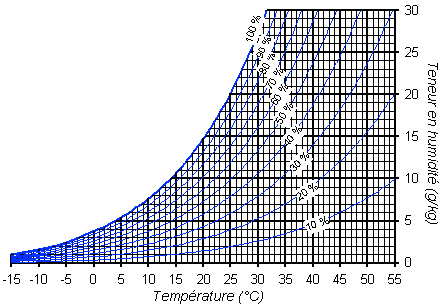
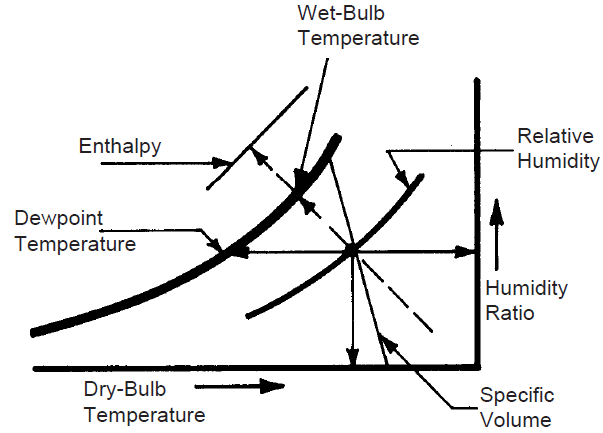
The “psychrometric diagram” of humid air is a tool to facilitate the representation of air transformations. In fact, this tool represents on a graph the main physical and thermodynamic characteristics of humid air.
For a given atmospheric pressure P, the psychrometric diagram makes it possible to read all the characteristics used for an air treatment study.
Quick explanations
Below is a simplified methodology to read it:
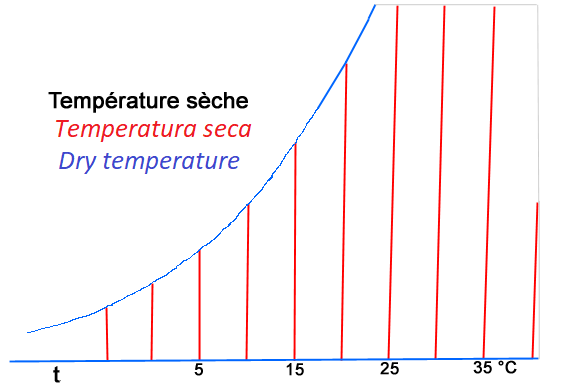
- Temperature axis (abscissa – horizontal axis) indicates the air dry temperature. Graduated from -15 ° C to 55 ° C.
- Absolute humidity axis (ordinate – vertical axis) or moisture content indicates the moisture content of the air. This is the amount of vapor present in 1 kilogram of dry air. It is expressed in grams of water vapor per kilogram of dry air and it is noted “r” [gvapor / kg dry air] (in short: g / kg. Graduated from 0g / kg to 30g / kg)
- Saturation of the air in water vapor limits the curve of the graph on the left. Corresponds to the maximum amount of water vapor that the air can contain without condensing. Actually, when the air contains this amount of vapor, it is saturated with humidity (hygrometry = 100%).
« The basic concept is that there is a relationship between temperature and saturation humidity. The saturation vapor content increases sharply with the air temperature. Hot air is able to hold a lot of water vapor. »
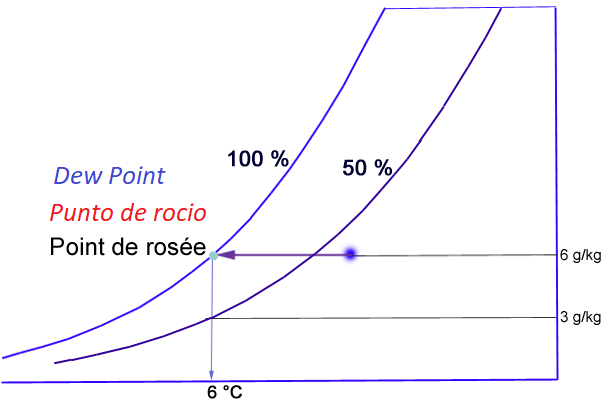
– Relative Humidity (RH %)
Relative humidity RH (or hygrometry) represents for a given temperature the ratio between the absolute humidity of the air studied and the maximum humidity that it could reach if it were saturated with vapor (absolute saturation humidity).
The RH is noted φ and is expressed as a percentage. A hygrometry of 100% corresponds to saturation. If we divide the water vapor content by two, the air is on a half saturated line, that is to say at Hr = 50% (we can also write: ϕ = 50%) .
.
– Dew temperature, humid temperature and dry temperature
Dew point temperature in °C
This is the temperature at which the water vapor in the air begins to condense when the air cools. In other words, it is the temperature (for a given moisture content : w) where the vapor reaches saturated vapor pressure.
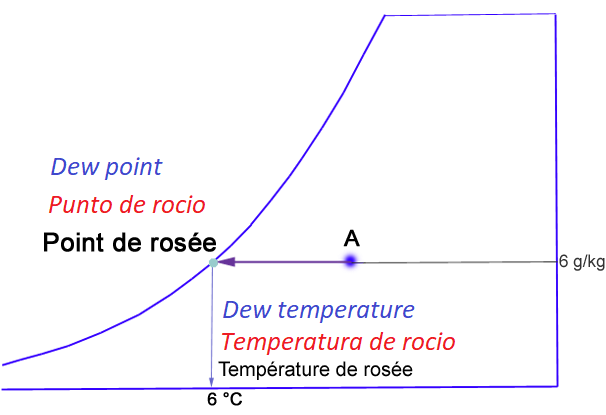
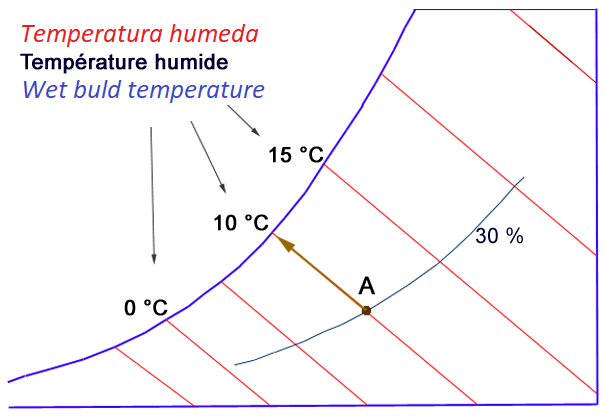
Wet bulb temperature in °C
The wet bulb temperature th is the temperature read on a thermometer (called a psychrometric thermometer) whose bulb is covered with cotton saturated with water and placed in a flow of air.
Indeed, the air in contact with the bulb produces evaporation which causes the temperature of the bulb to drop, which stabilizes when the air becomes saturated.
Dry buld temperature in °C
The dry air temperature ts is the temperature noted and read on a thermometer placed in a current of air, protected from all radiation.
To conclude, other air physical characteristics can be analysed and have to be taken into account in the psychrometric diagram.
Sources :
Diagramme psychrométrique (in French) : https://abitor2.files.wordpress.com/2013/11/diagramme_20psychrom_c3_a9trique_201-3.pdf
Psychrometric Chart Use: https://extension.psu.edu/psychrometric-chart-use
The Psychrometric chart and greenhouse climate control: https://hortamericas.com/wp-content/uploads/2016/05/JBWhitepaper.pdf
https://www.sciencedirect.com/topics/engineering/psychrometric-chart